In five steps
The calculator tells you how circular a product is, from a list of what it is made of, and shows where a change would make the most difference.
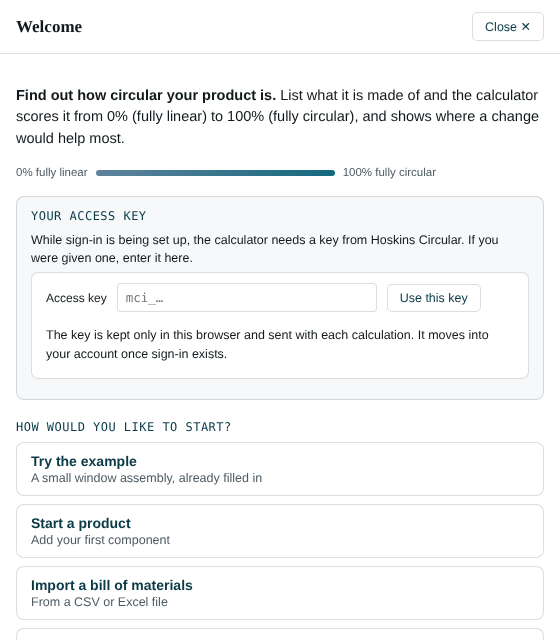
- List the parts. Add a line for each component, or import your bill of materials. Group lines into subassemblies if that is how you think of the product.
- Choose a material and a weight for each line. The material fills in typical figures for recycled content and end of life, so a first result appears straight away.
- Put in what you know. Change the recycled content and what happens at end of life wherever you have better figures than the defaults. Set how long the product lasts compared with similar products.
- Read the result. The score at the top is the whole product. Results shows which lines pull it down and why.
- Back it up. For each figure that lifts the score, record what supports it. Evidence shows how well the score is backed up, and can be handed to someone to review.
Not sure where to start? Use Try the example on the start screen: a small window assembly with every part filled in.
What the %MCI is
The Material Circularity Indicator (MCI) scores how much of a product's material flow is circular rather than one-way, from 0% to 100%.
A fully linear product is made from new material and ends up as waste. A product scores higher when it is made from reused or recycled material, when it is reused, recycled or composted at the end of its life, and when it lasts longer or is used more intensively than similar products.
The calculation follows the MCI methodology, as decomposed in Goddin (2026), and the conservative principles of ISO 59020. Every figure is calculated on the Hoskins Circular server; nothing you type is stored there.
How the score is made up
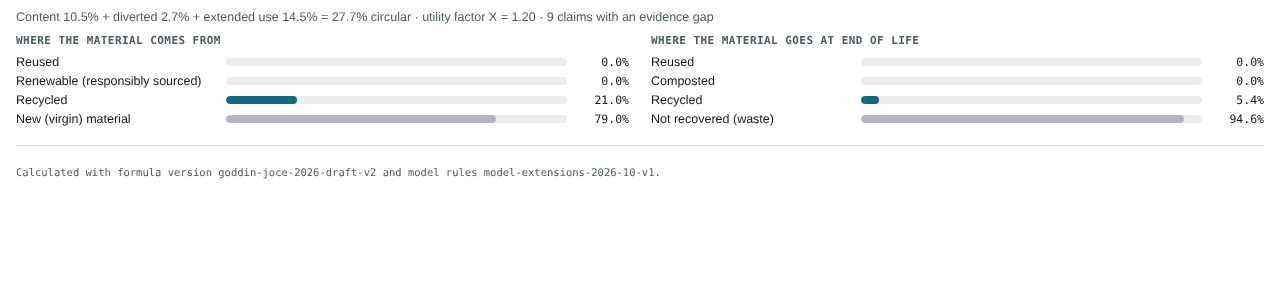
The score is the sum of three parts. The headline shows them as a sum, for example:

- Circular content
- Credit for using less new material: reused, recycled, remanufactured or responsibly sourced renewable content. (Raw material decoupling, RMD.)
- Waste diverted
- Credit for keeping material out of landfill at the end of life: reused, recycled, remanufactured or composted. (Waste decoupling, WD.)
- Extended use
- Credit for a product that lasts longer, or is used more intensively, than a typical product of its kind. A shorter life gives a penalty, shown as a minus. (Enhanced utility, EU.)
Components and subassemblies
The Bill of materials section is the list of what the product is made of. Each line is a component with one material. A subassembly groups lines, and has a quantity of its own: a subassembly of four wheels, each with a rim and a tyre, is one subassembly with quantity 4.
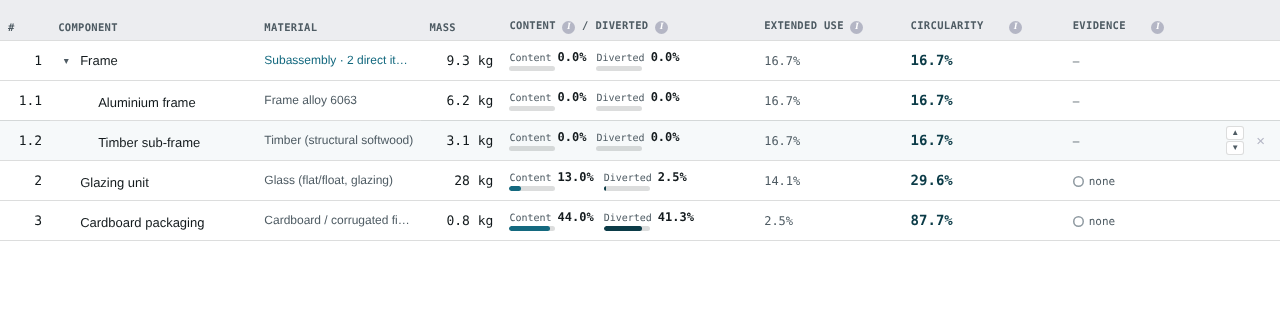
- + Add component adds a line and asks for its material first.
- Click a line to open it beside the table. Only one line is open at a time.
- Use the arrows at the end of a row to move it up or down, or Move to in the open line to put it in a subassembly.
- Each column heading can sort the table; the funnel beside it filters.
Editing a line
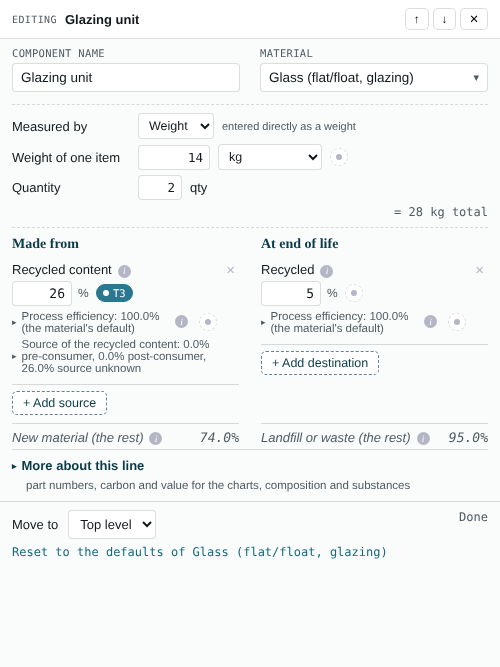
An open line has its name, material, weight and quantity at the top, then two lists side by side: Made from and At end of life.
Routes in and out
Each list shows only the routes the line uses, always in the same order, from the most circular to the least:
- Made from: reused content, bio-based content (and how much of it is responsibly sourced), remanufactured content, recycled content.
- At end of life: reused, composted, remanufactured, recycled, and energy recovery (Full methodology only).
Choosing a material fills in its typical figures, so the routes it uses appear by themselves. To add another, use + Add source (where the material comes from) or + Add destination (where it goes at end of life): it goes straight into its place in the order, so nothing already on screen moves, and the cursor is in its box. The × beside a route removes it and its figure. Reset to the material's defaults puts the material's figures back.
A recycling figure has a process efficiency under it (how much of what is collected comes out as usable material). It starts at the material's default; change it only if you know better.
Whatever is not covered by the routes you give is counted as new (virgin) material going in, and as landfill or waste going out; the two are shown level at the foot of the lists. You never type those in.
More about this line
Part numbers, the carbon and value figures used by the Hotspots chart, and the line's declared composition and substances. This part opens by itself when any of it is filled in.
Weights and units
A line can be entered as a weight, or as a length, area or volume with a weight per unit (for example 3 m of cable at 0.12 kg/m). A line with no weight is left out of the result and marked Needs a weight; the score is then for the weighed lines only, and the top bar says so. Add weights… lets you fill in the missing ones together.
Display units (metric or US) are under Menu › User settings.
Product life
Two figures in the top strip set the extended-use part of the score: Expected life of this product and Typical life of similar products. When they are equal there is no credit or penalty; a longer life than typical earns credit, a shorter one costs points.
Base both on something you can point to: a warranty, a design life, an industry guide. In the Full methodology (see Assessment scope) how intensively the product is used, and its typical mass, count too.
Importing a bill of materials
Import BoM… reads a CSV or Excel (.xlsx) file in your browser; it is not sent anywhere. You say which column holds the name, material, quantity, weight and so on, then confirm a material for each different wording in the file. Nothing is given a material without your say-so, and each imported line keeps the text of the row it came from.
Your own materials and suppliers
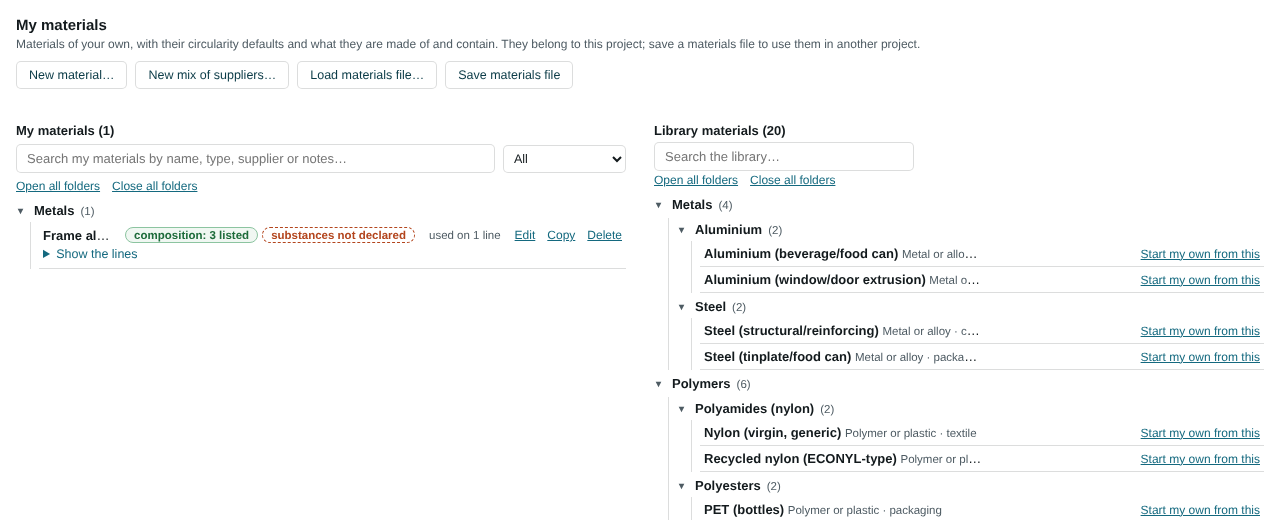
Materials & sources › Materials holds the built-in library and your own materials. An own material starts from a library material and carries your figures: a supplier's grade with a known recycled content, say. A mix combines several supplier versions of one material, in shares.
Results: Breakdown
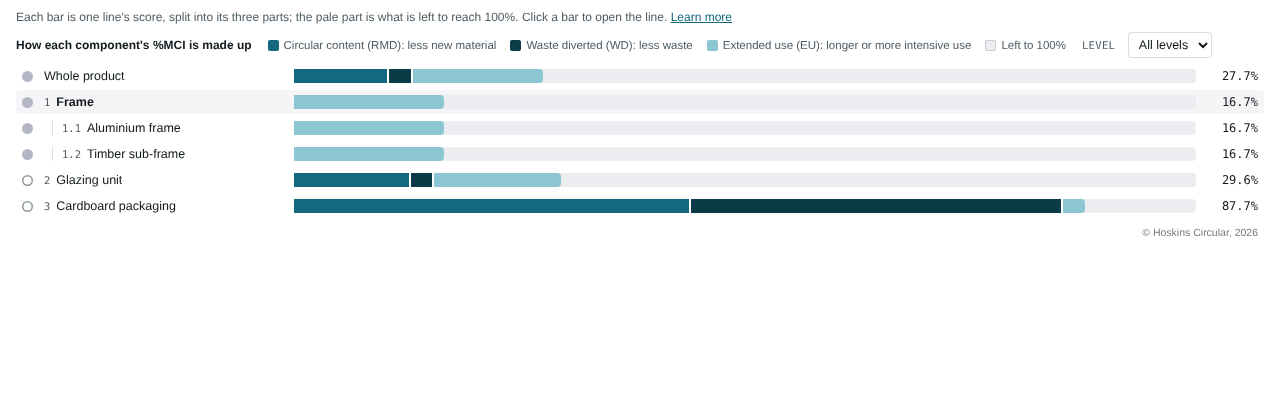
One bar per line, split into the three parts of its score. The pale remainder is what is left to reach 100%. Use it to see why a line scores as it does: a line with no circular content and no waste diverted only gets its extended-use credit.
Results: Hotspots
Each point is a component, placed by its %MCI (across) and its carbon footprint or material value (up); the two drop-downs above the chart change what is measured each way, and Show can keep just the few with the lowest score, or the most carbon or value. Points towards the top left, low score and high carbon or value, are where improving circularity matters most. The dashed lines mark the middle of the points shown.
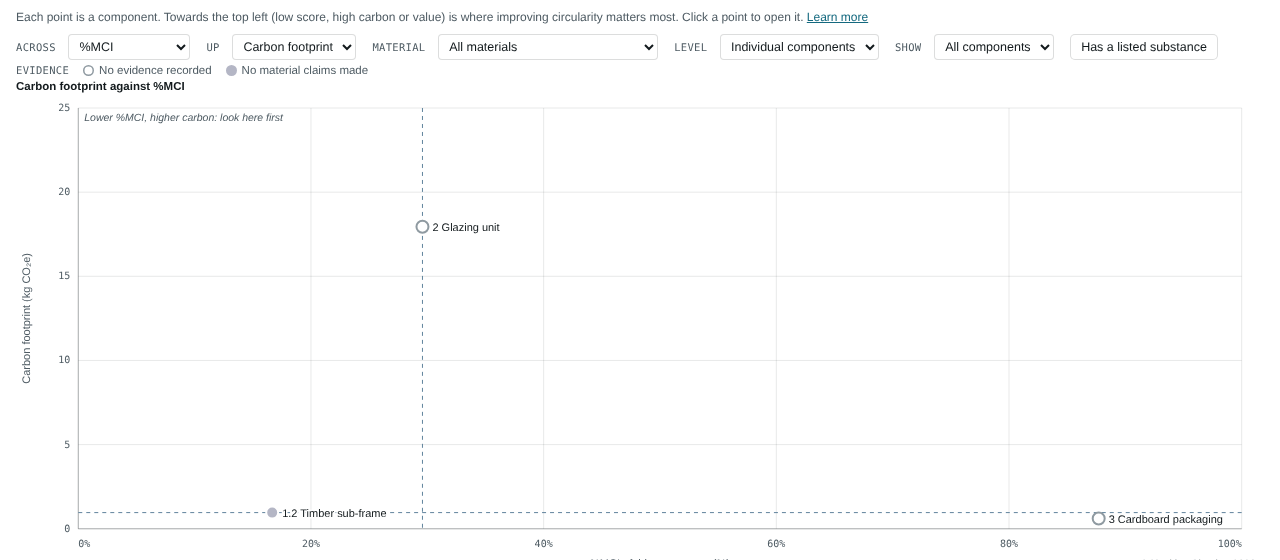
A point's colour shows how well its figures are backed up: the weakest figure sets the colour. Carbon and value come from the material library unless you give the line its own. They never change the %MCI.
Results: Mass flow
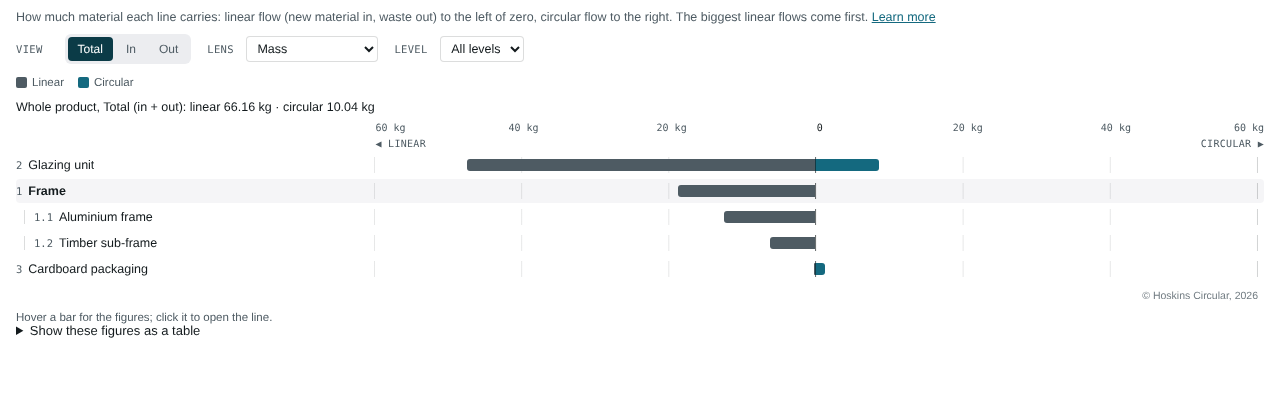
The material itself rather than a ratio: for each line, the kilograms that flow linearly (new material in, waste out) to the left of the zero line and circularly to the right. Lines with the biggest linear flow come first, because that is where the big wins are. In and Out show the two ends separately.
Results: Calculation details
The whole product's material flows, where the material comes from and where it goes, in shares of the mass, with the versions of the formula and the model rules used. Any problems the calculation found are listed here too.
Product life chart
The whole product's %MCI against how long it is kept, under three end-of-life outcomes: everything reused or composted, your stated end of life, and everything landfilled. What happens at the factory stays the same in all three; only what the user controls changes.
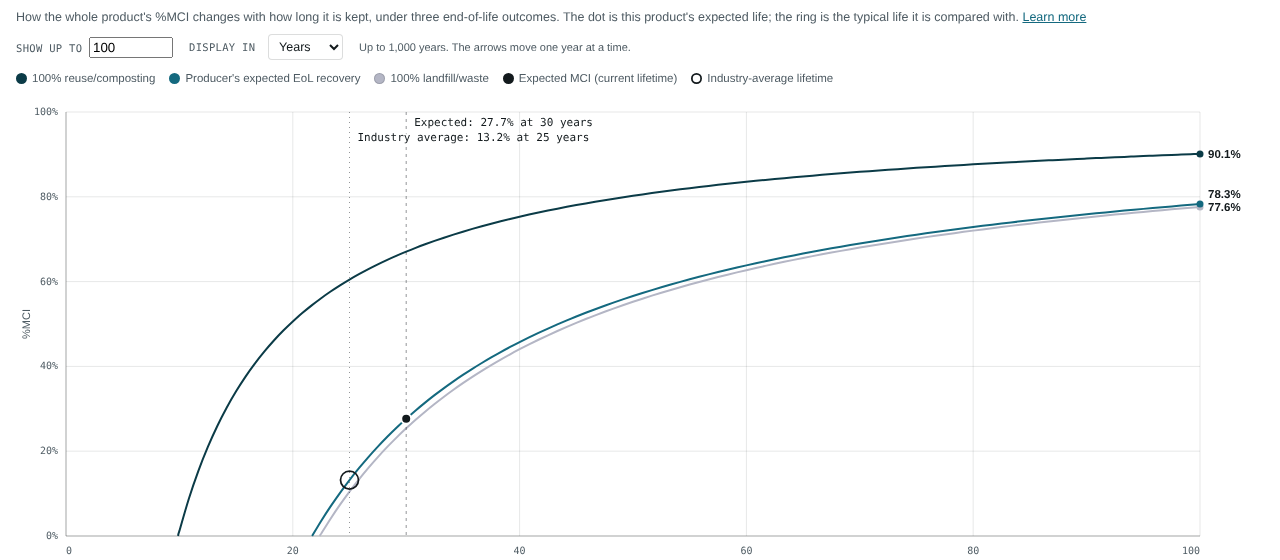
The dot is the expected life you gave; the ring is the typical life it is compared with. A curve starts only once the score reaches 0%, because the formula goes negative at very short lives and that is not a meaningful score.
Backing up a figure
A figure that lifts the score is a claim: recycled content, an end-of-life route, a longer life than typical. Beside each claim is a small evidence marker. Click it to record what supports the figure: the tier, the source document, where in it, and its version.
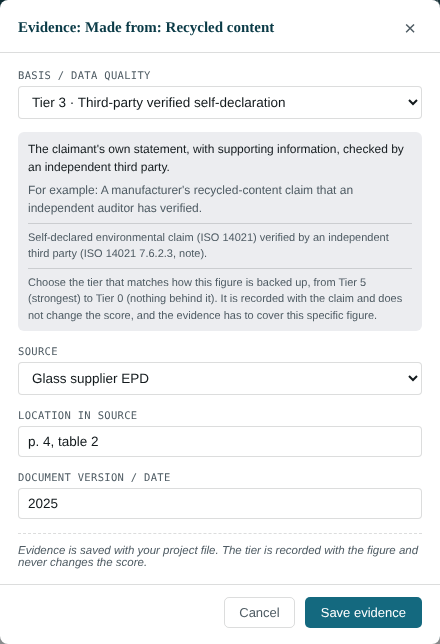
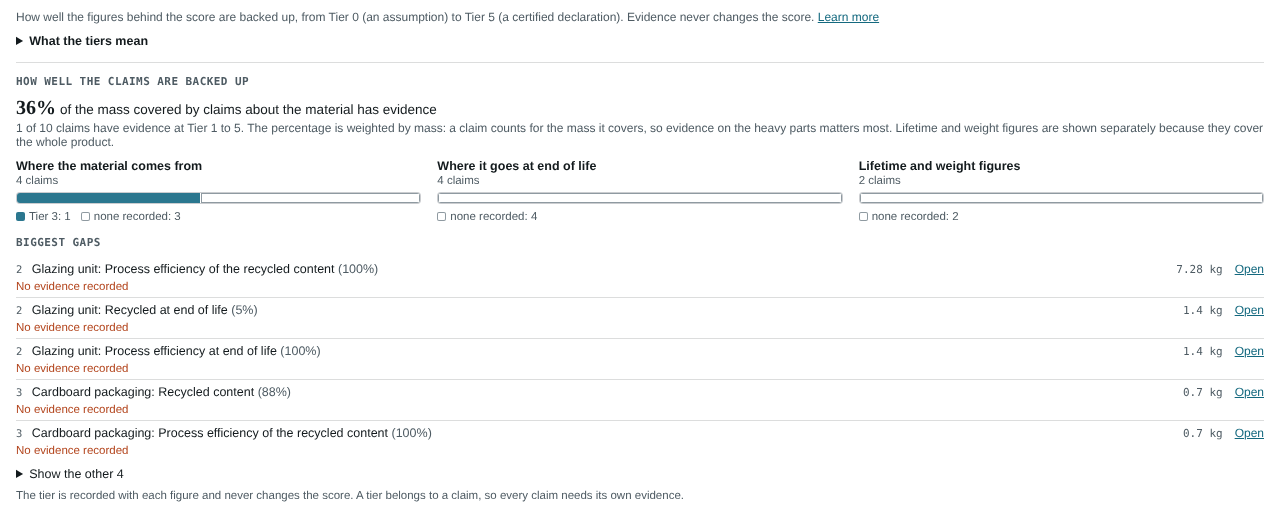
Evidence never changes the score. It tells you, and anyone you share the result with, how far the score can be trusted. Evidence › How well it is backed up shows the share of the claimed mass at each tier and lists the biggest gaps first.
The evidence tiers
From strongest to weakest. A tier belongs to one figure, so every claim needs its own.
| Tier | What it means |
|---|---|
| Loading… | |
Sources
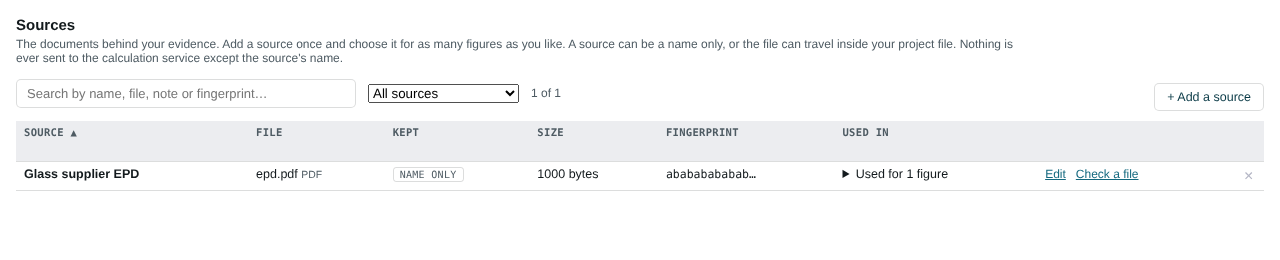
A source is a document that backs up evidence, added once and chosen for as many figures as it supports (Materials & sources › Sources, or from the evidence form). Each source is one row, with its file, size, fingerprint and the figures it backs; the list can be searched, filtered and sorted. A source is either reference only (its name and a fingerprint are recorded, nothing is kept) or kept in the project file (the file travels with the project). Kept files are checked for the common kinds of active content, and are only ever offered as a download, never opened in the page.
Having the evidence reviewed
Evidence › Review is for someone checking the claims: a team lead, or a consultant assessing the circularity claimed. It lists every claim, biggest first by the %MCI points it is worth, beside its source.
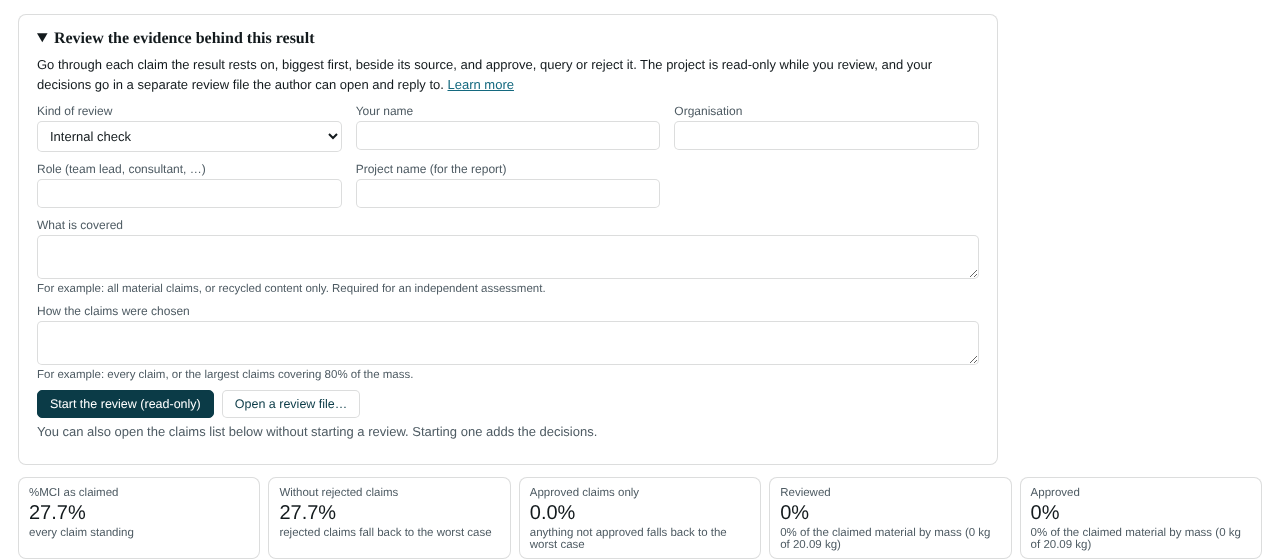
- Start the review with a name (an independent assessment also needs an organisation and what is covered). The project is then read-only.
- For each claim: Approve, Approve at a lower tier, Raise a query, Reject (with a reason) or Cannot verify.
- The tab shows the %MCI as claimed, with rejected claims taken out, and with only approved claims standing, where anything not approved counts as the worst case (all new material, all landfilled, average life).
- Decisions are saved in a separate review file. The author opens it beside the project, sees each comment and replies. A claim changed after it was reviewed shows as Changed since reviewed.
- Report (PDF) and Report (Excel) give a record to hand over.
The reviewer's name is as they typed it and the file is not signed, so this is a record of a review, not a formal verification statement.
Critical minerals
Minerals & substances › Critical minerals follows critical minerals through the product: how much of each is in it, and how circular its flow is. Choose one or more national lists to follow, or type your own shortlist. A mineral is counted only where a line's composition is declared (in its own material, or yours); a line with nothing declared is shown as a gap, never as "none".
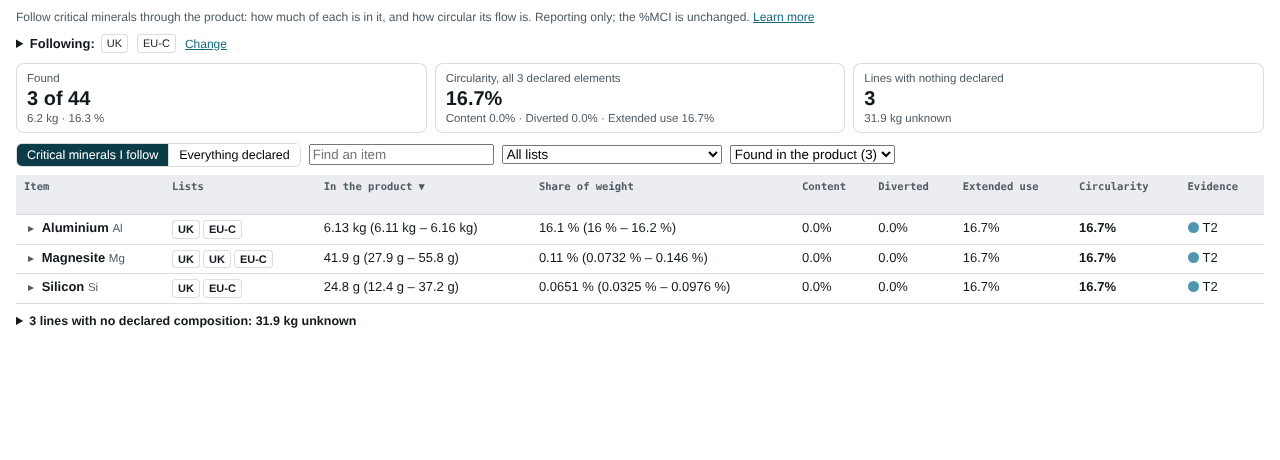
How to read it
- Each line's weight is multiplied by what is declared for it, so an item is counted only where a composition is declared.
- A line with no declared composition is unknown, not "nothing present"; the count of such lines is shown in the tiles.
- Items on more than one list are counted once; the totals never add the same material twice.
- Compounds are matched by name only (cobalt oxide is not counted as cobalt), so declare the element if you want it counted.
- Content, diverted, extended use and circularity are the product's own measures, worked out from each item's share of the mass flow of the lines it sits in. Extended use comes from the product's lifetime figures.
- Bands are those of the PCDS product composition statement (range 1). A range that crosses a band edge or the threshold is shown as "may be reported" rather than guessed.
Reporting only: the %MCI is unchanged.
Substances
Minerals & substances › Substances checks the declared substances against reference lists (EU RoHS Annex II is built in; you can load others, such as the REACH Candidate List). Each finding shows the line, its share and whether it is over the threshold you choose. The PCDS 3.2.0.01 line is the passport statement "no known hazardous substances according to the cited reference": it says whether that statement can be made against the list chosen, and if it cannot yet, what is missing. It is never answered yes by default.
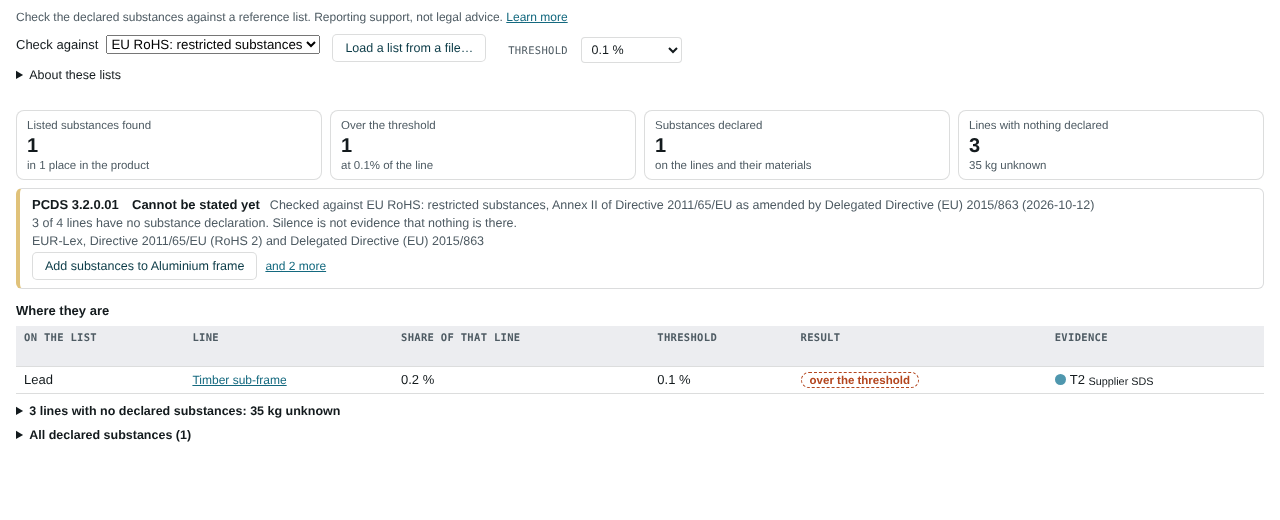
How to read it
- Shipped lists are matched by EC number, name or alias, never by CAS number, so give the substance's name or EC number.
- The comparison uses each substance's share of the line it is declared in, on the basis the list states (article, homogeneous material or product).
- Check the list's own text for exemptions and for what counts as an article.
Reporting support, not legal advice.
A portfolio
A portfolio puts several saved products together, like a bill of materials whose lines are whole products. Switch to it with Portfolio in the top bar (or Menu › My Portfolio).
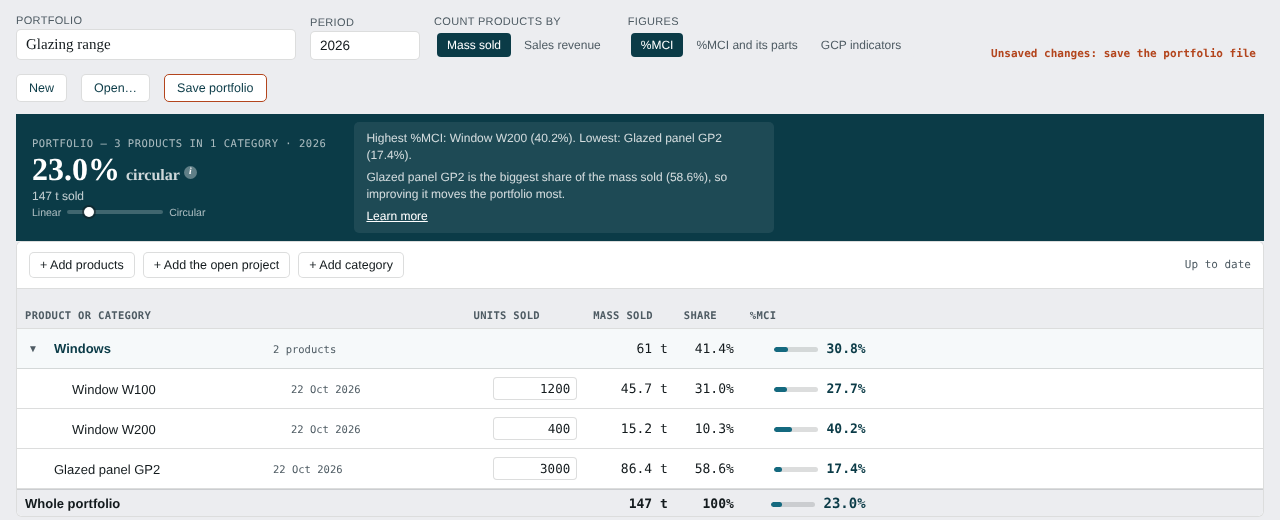
- Add products. Choose one or more project files you have saved, or add the project that is open in the editor.
- Enter the units sold (or produced) in the period for each product. A product with no units is shown but not counted yet.
- Group them with + Add category, and move a product into a category with its Top level list. Categories can sit inside categories.
The %MCI is shown for each product, each category and the whole portfolio. Beside the headline, a short summary names the product with the highest %MCI, the one with the lowest, and the one that is the biggest share of what was sold: improving that one moves the portfolio most. Figures chooses what else the table shows:
- %MCI (the default): just the score, the units sold, the mass (or revenue) and each product's share.
- %MCI and its parts: also the mass of one unit, and each product's circular content, waste diverted and extended use.
- GCP indicators (a licence option): circular inflow, circular outflow and material circularity instead of the three parts. They are weighted by mass sold, as the GCP adds up flows. With prices entered, the strip under the headline also gives material circularity revenue and circular material productivity.
The portfolio is a licence option.
How products combine
The portfolio's %MCI is the average of its products' %MCIs, weighted by how much of each was sold. This is the company-level method of the original Material Circularity Indicator methodology (Ellen MacArthur Foundation, section 3.1.5). Count products by chooses the weight:
- Mass sold (the default): the mass of one unit times the units sold. This is the method's most consistent option. Heavy products count for more.
- Sales revenue: the price of one unit times the units sold. High-value products count for more. Enter a price for each product.
Each product keeps its own life, so a long-lived product's extended use is not given to the others. A category is worked out from the products inside it, and the whole portfolio from all of them. Each product carries the scope (Standard or Full) of its own project. A note appears when products use different scopes, because their figures are then not like for like. When reporting, state the period and the weight you chose. The method also suggests a reference product for each range of similar products, and allows products to be left out only if they are under 5% of the mass and of the revenue.
A product whose own %MCI is below 0% counts as 0%, as the methodology defines a product's MCI; its note says so, and with %MCI and its parts the three parts are shown as calculated. A product whose project still has lines without a weight is counted on the lines that have one, with a note on its line: add the weights in the project, save it and use Update….
The portfolio file
Save portfolio downloads a portfolio file. It holds a copy of each project, so it opens anywhere with the same figures. The copy leaves out source files kept inside a project (their names and fingerprints stay). When you change a product, save its project file again and use Update… on its line. Open loads a line into the editor.
GCP indicators
The Global Circularity Protocol (GCP v1.0) is a framework for organisations, so its figures are in the portfolio, and the product views stay on the %MCI. Figures › GCP indicators shows them for each product, each category and the whole portfolio. The GCP button on a product's line opens that product's figures: the three headline figures, each with one plain sentence, the product's %MCI for comparison, and four more indicators. How these figures are worked out holds the scopes, how material circularity relates to the %MCI, the evidence behind each figure and the longer notes. The figures are worked out from the same bills of materials as the %MCI and do not change it. It is a licence option.
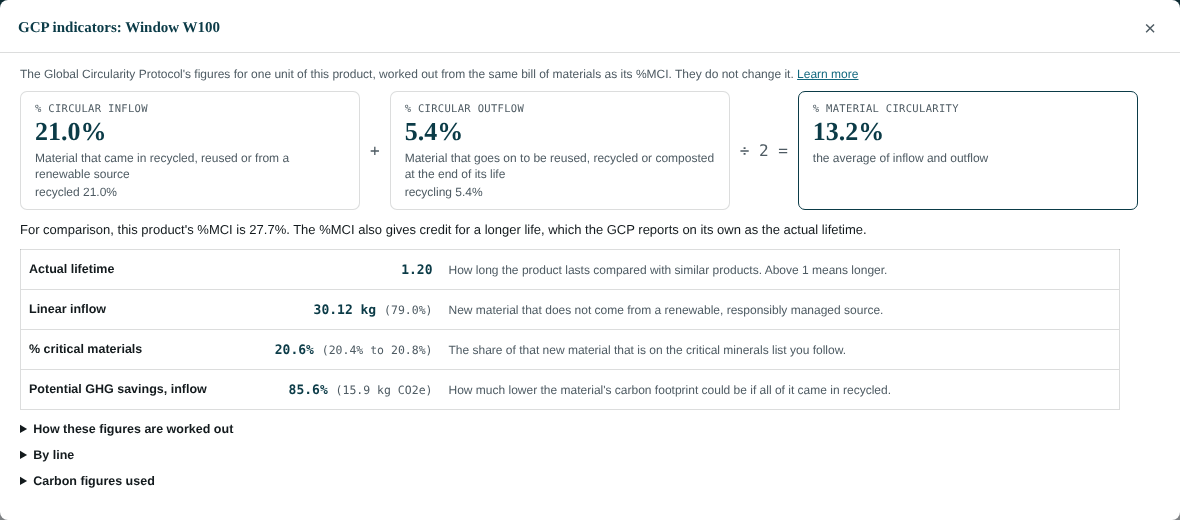
- % circular inflow: recycled, reused and responsibly sourced renewable content.
- % circular outflow: what is recovered at the end of life (reuse, recycling, composting, and energy recovery from bio-based material under the conditions the GCP takes from the MCI). Recycling counts at its recovery rate, so what is lost in the recycling process is left out.
- % material circularity: the average of the two. With no recycling-process losses it equals the %MCI's circular content plus waste diverted exactly; the %MCI also counts extended use.
- Actual lifetime: expected life ÷ typical life. The GCP asks for the average life in use, not the design life.
- Linear inflow: new material that is not responsibly sourced renewable.
- % critical materials: critical material that came in as new material, as a share of the linear inflow. That measures exposure to mining and primary production. It uses the lists the project follows in Critical minerals and needs declared compositions (and the Criticality module).
- Potential GHG savings, inflow: the carbon of the material as it is, less the carbon if all of it came in as recycled grade, from each line's carbon figures (the library's cited figures, or your own). A line with no recycled-grade figure claims no saving. Where the library's new-material figure is a market average that already includes recycled material (steel, for example), the primary-route figure is used for the new material. Reused content, and the kept part of remanufactured content, carries a share of the new-material figure set in Project settings (0% by default, the GCP's cut-off). Carbon figures used lists every figure and its source. A potential saving, not avoided emissions.
How these figures are worked out says how many of the claims behind each figure have evidence. By line gives each line's figures, and Carbon figures used the carbon figure behind each line's saving.
The end-of-life figures you enter are treated as the GCP's actual recovery. Recovery potential (what could be recovered if collection and treatment were perfect) is not recorded, and downcycling counts as recycling.
Saving and opening
A project is a file on your computer. Save project (top right, or Ctrl+S / Cmd+S) downloads it; Menu › My Projects › Open opens one. The top bar says when there are unsaved changes. While there are, a copy is kept in this browser and offered back if the tab is closed. A portfolio is saved in its own file (see A portfolio).
Product and market
Menu › Project settings › Product and market names the product and says where it is sold and recovered. Choose the market from the standard list of regions and countries (the UN regions, with England, Scotland, Wales, Northern Ireland, the US states, Canadian provinces, Australian states, New Zealand regions and German Länder). Then add your own sub-regions below it, for example United Kingdom › England › Kent › Dover. The project file is named after the product and its market.
- End-of-life figures for the market. Where the material dataset has figures for a region, a material chosen afterwards takes the figures for the nearest region at or above the market (else the global figures), and the line says which. Lines already chosen keep their figures. Where there are no regional figures, enter your own with their evidence, as for any figure.
- The same product in another market. Make a variant for another market… turns the open project into that market's variant, in the same family: sourcing and end of life can then differ as they do in that market. Save it as a new file; the file you opened is unchanged.
- In the portfolio, each line shows its market, the units sold on a variant are that market's sales, and the Region filter keeps the products sold in a region (Europe takes in the United Kingdom, England, Kent and Dover). The figures are then for those products only.
Your settings: units, currency, language
Menu › User settings holds what applies to you rather than to one project. They are kept in this browser.
- Currency. Choose your currency and your own rate (1 USD = …), with the date of the rate. For pounds, euros and Australian dollars the rate the library's prices were converted with is offered. The library's material values are in US dollars and are shown in your currency at your rate. A value you type is kept in the currency you typed it in, with the rate, so changing the rate later does not change it. If your currency is not in the list, choose Other… and type its code or the label you use.
- Language. English, German, French, Spanish, Portuguese (Brazil and Portugal), Italian and Japanese; Danish, Swedish, Korean and Chinese are to follow. The translations are a first, machine-made draft that native speakers have still to check. Numbers follow the language too: in German, French, Spanish, Portuguese and Italian a quarter is written 0,25, and either 0,25 or 0.25 can be typed. Where a number could be read two ways (1.500 is fifteen hundred in German), the box says how it was read.
- Display units. Metric or US customary, for how masses are shown.
Assessment scope
Menu › Project settings. Standard (ISO 59020) is the conservative default, matching what Green Star, the Infrastructure Sustainability Council and ISO 59020 currently recognise: no energy-recovery credit, and extended use based on life alone. Full methodology adds energy recovery (under strict conditions), intensity of use and typical mass.
What each figure means
The plain wording also appears behind each (i) in the calculator; the technical detail is kept here.
Loading…